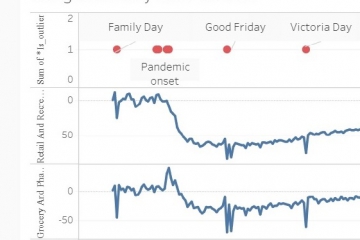
Find out what is hiding in your data

Some outliers are obvious, but data outliers may not be. Data entry errors, suspicious transactions and faulty processes can all cost you dearly. On the other hand, knowing about your exceptional customers is vital. Penny Analytics finds your data outliers, ranks them by their importance, and gives you the reasons why.

Outlier detection for average people

You only need Excel skills and it’s easy to get started. Create an account and upload one of our free trial datasets. Choose your data retention option and place your order. 95% of orders are ready in less than an hour.

Safe and secure

Data is kept securely in the cloud and follows data retention policies. Our standard policy is that data is deleted after a month, but you can choose to get it deleted after a day. Put our data security to the test during your free trial.

Like a laundry service

No need for data scientists, consultants or software. You drop off and pickup and we do all the work in between. It’s simple and economic, you pay per transaction and nothing else.

We provide an alternative to the traditional ways of getting data science done. Who else would try to sell themselves as a laundry service?

Free data profiling

Penny Analytics provides a free data profiling report after every successful file upload. This allows you to learn more about your data and verify aspects of its data quality without any further obligation. Get your first data profiling report during your free trial.

Our LEARN section is packed with information. Watch our one minute explainer video. Browse our FAQs. Start your free trial.

Do you need outlier detection to do your job?

What does a child with a driving license, a transatlantic flight for less than a dollar, and skyrocketing demand for celtic rock records have in common? They are all outliers. And they probably need your attention. But you need business intelligence to find them in the first place.

AI and machine learning are today's buzzwords. Penny Analytics provides an easy pathway for you to add intelligence to your work, whatever the size of your organization. As long as you have datasets that are too large for you to analyze by hand, then we can find the most unusual records for you. At Penny Analytics, we find outliers in your data, whether your data is standard multivariate or time series. If you are a business user with some Excel skills, then this is the user friendly anomaly detection system you have been searching for.

Business analyst

Sample industries: telecommunications, venture capital, management consulting, marketing analytics

Video on outlier detection for Excel users

Accountant

Sample industries: accounting, finance

Case study on expenses claim fraud

Data quality specialist

Sample industries: technology, pharmaceuticals

Case study on data quality
Second case study on data quality

Dev ops professional

Sample industries: internet, software

Case study on time series anomaly detection
Video on time series anomaly detection

Internal auditor

Sample industries: banking, gambling and casinos, government administration

Case study on fraud detection
Video on fraud detection

Claims adjudicator

Sample industries: healthcare, insurance

Case study on fraud detection
Video on fraud detection

Data journalist or researcher

Sample industries: media, education, legal, public safety

Case study on public education data
Preferred pricing for public research

Data scientist or data engineer

Sample industries: financial services, big data, social media

Case study on data quality
Second case study on data quality

Operations manager

Sample industries: transportation, manufacturing, internet of things

Case study on time series anomaly detection
Video on time series anomaly detection

We are devoted to outlier detection and demonstrating its many uses

We use our outlier detection service for public research. You can use our blogposts to understand more about how our service works and how outlier detection can be applied in real life. We have found outliers in handwriting samples, financial transactions, American cities, flower species, demand for taxi trips, and Canadian weather - and are always looking for new research areas. We publish our visualizations to Tableau Public.

Copyright © 2020 Penny Analytics Limited All rights reserved.