Have you ever had a school detention? At Penny Analytics, we have to admit that we have some experience in that department. If you were lucky, they just let you do your homework (which needed to be done anyway). If you were unlucky, then they gave you a tedious task like writing lines. So, you might be asked to write “I will not interrupt my math teacher” one hundred times. This was indeed a tedious task, but at least it was not difficult.
The human eye has evolved to be a powerful organ. But to the human eye, outlier detection is both tedious and difficult. This is why radiology is a medical specialty. In today’s post, we look at a dataset full of images and run it through our outlier detection system.
The dataset is called “digits” and can be found on data.world:
This dataset is typically used to train handwriting recognition models and consists of 64 columns that contain ink densities within an 8×8 grid of pixels. So, these 64 columns describe the image itself. Then, there is one last column which is the label between 0 and 9.
Here is what the first record in the dataset represents:
And here is the data profiling report for this dataset:
(To enable all features of the data profiling report including toggle details, you will need to download it and open it from there.)
Unlike many business datasets, it is hard for us to interpret these columns directly, since they each represent a pixel. Instead, we are going to look at the images themselves.
Let’s start by looking at all the images in this dataset, but without the labels. This quite an eyeful, and if your detention teacher asked you to find outliers in this set of digits you would be right to be horrified, snowflake or not.
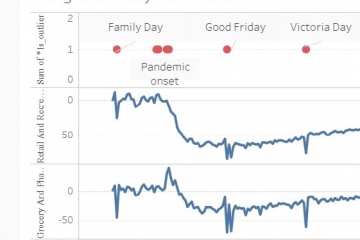
The pandemic has changed our mobility patterns. In this blog, we work with time series data collected by Google and we have drilled down to Toronto, Ontario (home of the CN Tower and also Penny Read more…
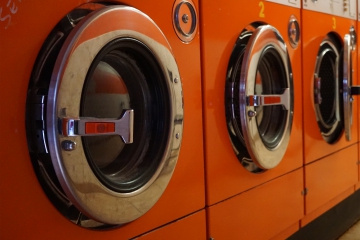
When we moved into our house, it came with the appliances from the previous owner, including the washing machine. The washing machine was similar to the one I had grown up with, and was probably Read more…
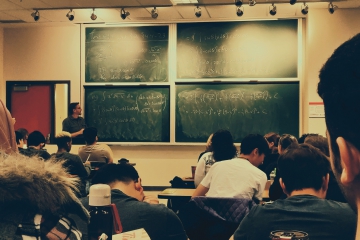
More than twenty years ago, I lived in a university town in Canada and taught math and engineering courses. In each of these, there was always a concern about students cheating on assessments and exams. Read more…