In this blogpost, we apply outlier detection to 80 years of daily Canadian weather data. We keep reading that our climate is changing – temperatures are increasing and that extreme weather events are happening more often. We were interested in the frequency and types of “weird weather days” the Penny Analytics system would find over this long time series.
We have compiled the dataset from public sources. You can download it from here, or from Kaggle where we have also posted it. The dataset consists of daily temperatures and precipitation from 13 Canadian centres. In 1940, there is daily data for seven out of the 13 centres, but by 1960 there is daily data from all 13 centres.
Few of Canada’s weather stations have been operating continuously, so we did need to patch together the data. Our source data is from https://climate-change.canada.ca/climate-data/#/daily-climate-data and here are the weather stations that we queried:
CALGARY INTL A
CALGARY INT'L A
EDMONTON INTL A
EDMONTON INT'L A
HALIFAX STANFIELD INT'L A
HALIFAX STANFIELD INT'L A
MONCTON A
MONCTON A
MONTREAL/PIERRE ELLIOTT TRUDEAU INTL
MONTREAL/PIERRE ELLIOTT TRUDEAU INTL A
OTTAWA INTL A
OTTAWA MACDONALD-CARTIER INT'L A
QUEBEC/JEAN LESAGE INTL
QUEBEC/JEAN LESAGE INTL A
SASKATOON DIEFENBAKER INT'L A
SASKATOON INTL A
ST JOHN'S A
ST JOHNS WEST CLIMATE
TORONTO INTL A
TORONTO LESTER B. PEARSON INT'L A
VANCOUVER INTL A
VANCOUVER INT'L A
WHITEHORSE A
WHITEHORSE A
WINNIPEG RICHARDSON INT'L A
WINNIPEG THE FORKS
Here is the data profiling report:
Canadian_climate_history_profiling_report.html
(To enable all features of the data profiling report including toggle details, you will need to download it and open it from there).
From the data profiling report, you can see that we have about 29000 records and 27 columns – the date along with the temperature and precipitation at each of the 13 centres.
We then ran the dataset through our outlier detection service. The Penny Analytics outlier scores are accompanied by reason codes. We have used the reason codes to classify the “weird weather days” into four buckets:
641 days high precipitation (rain, snow)
153 days low temperatures
26 days high temperatures
10 days low precipitation
So, the weather anomalies were dominated by either high precipitation or low temperatures. Yes, this sounds like Canada!
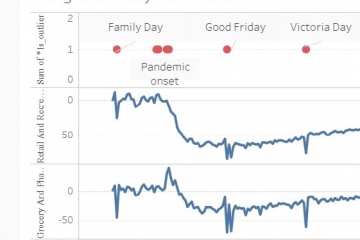
Here is a picture of the outliers. We have divided the picture into the winter months (November to February) and the rest of the year.

Winter – Two thirds of the outliers are found in these months. This picture shows that in recent years we are getting fewer harsh winter days and also more days that are unusually warm for the time of year. And we seem to be having somewhat fewer big snow days than we used to. For many Canadians, this sounds like a blessing! For others, in northern Canada, or those who rely on winter conditions to make a living, it’s an adjustment.
Rest of the year – Firstly, although we complain of the summer heat, those very hot days are not coming through as outliers. What we do see is an increase in heavy rain events. For Canadians, this translates into more wet basements and other expensive damage.
In the Penny Analytics outlier results, the outliers are ranked, with 1 being the biggest outlier. When we looked more closely at the rankings, we did not see any evidence that the outliers were becoming more severe over time, or that there are any more outliers in total, just that the mix of extreme weather events has changed. That mix has become warmer and wetter.
Canadians are obsessed by the weather and climatologists have been documenting our weird weather for more than a century.
At Penny Analytics, we are not climate scientists, but we do provide a data science service. What we have demonstrated is how to find outliers in a dataset containing several time series. Our outlier detection service can process 200 columns of data, although if each one of those columns were time series the effective limit is more like 40. Our system finds the records/dates that are outliers, and gives reasons why. To find out more about our time series solution, start our free trial using our NYC taxi dataset.
The Penny Analytics Canadian climate outlier file is here:
Canadian_climate_history_penny_outliers_1750_214.csvAlso, you can play with the Canadian climate visualization yourself by going to our pages in Tableau Public.